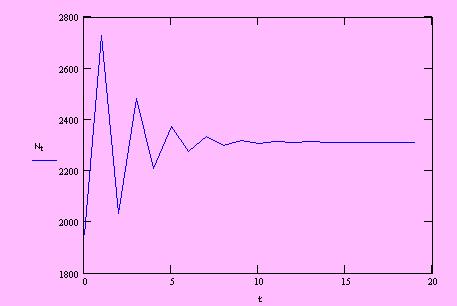
Growth curve at each time step
along t :
which in transpose form of Nt :
Each column of the Matrix NT consists of a "one step" or an age vector of
the population. The leftern most column is the initial vector N0.
The total population of each vector will To construct a graph
of the population growth along the time steps 0 ... t, we have to find the total
population in each vector Nt :
Say NT is the vector of the population at time or step t, then
following
Leslie equation:
Enter the time step (how many step to simulate)
Enter data for vector of initial population of each
stage:
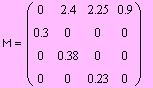
Thus we have the Leslie Matrix, M :
Enter data for p statistic:
Enter number of stage (x):
Since p (survival
data) are located diagonally starting at first column and second row, to enter p
we firstly construct a vector of x-1
dimension (n = x-1).
Also consider that Origin=0 is used in this Mathcad
program.
Statistics needed for population growth simulation using
Leslie model are:
F (fecundity) and
p (survival) of the population in each
stage of development or
age-class, and the initial population vector N. ( in some texts, m is used for F and
s for p ).
Say, x is the number
of age-class, the Leslie transition matrix is Mx.x.
A Mathcad program for Leslie
model population growth simulation,
by Rudy C Tarumingkeng,
IPB-Bogor, Indonesia
MATRIKS
PROYEKSI LESLIE --- PROGRAM MATHCAD